Approaching First Nations, Inuit, and Métis data with visual empathy
For its expert blog, the Canadian Partnership Against Cancer (The Partnership) wanted to disseminate information about the realities of receiving cancer care for First Nations, Inuit, and Métis.

- Client
- Canadian Partnership Against Cancer
- Sector
- Gov't & NFP
- Focus
- Service Design
Challenge
The Partnership reached out to PIVOT for help with the design of a digital blog for the expert healthcare community. In this 6-month engagement with The Partnership, Pivot was committed to create and design infographics and data visualizations for a different theme each month. While policymakers and researchers were the primary audience, Pivot wanted to ensure that all of the shareable content that we were developing was designed to be easily understood by the general public as well.
Solution
When the theme of Cancer Care for First Nations, Inuit, and Métis (FNIM) arose, Pivot engaged with The Partnership's FNIM community partners to understand the meaning and symbolism behind iconography and colours. Using the information gained from these discussions, Pivot was able to design 3 important infographics with the focus on visualizing data in a way that would represent the various patient journeys as well as be sensitive to the culture and diversity within them.
- FNIM Grounding Graphic
- First Nations Journey
- Inuit Patient Map
Impact
The Partnership and their audiences were overwhelmingly impressed with Pivot's attention to detail and empathy shown in the process of designing these graphics — especially given the short amount of time to develop the assets for the monthly blog. The FNIM partner community groups went on to develop further communications using Pivot's core visual concepts.
More Work
View all case studies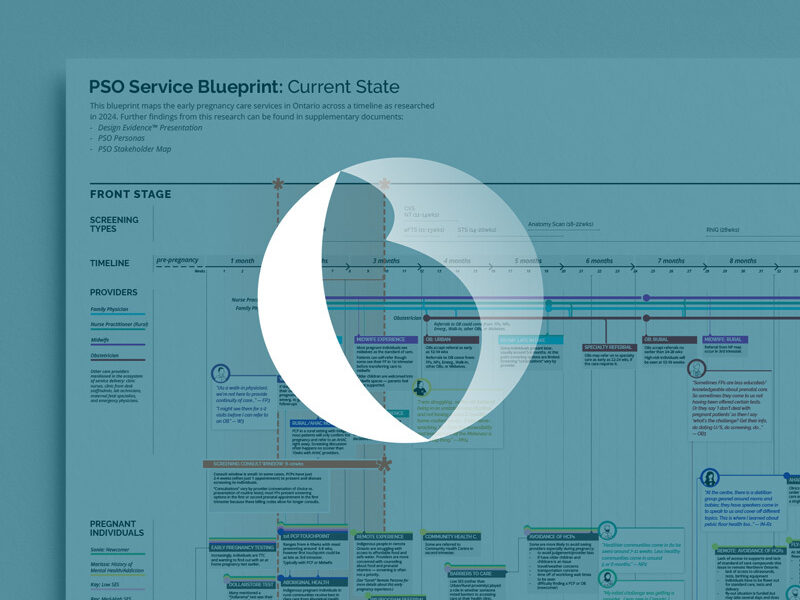
How a service design approach revealed new ways to reach Ontario’s most underserved