
Design that makes systems work for people
Celebrating the release of our latest project, the OurCare Data Explorer.
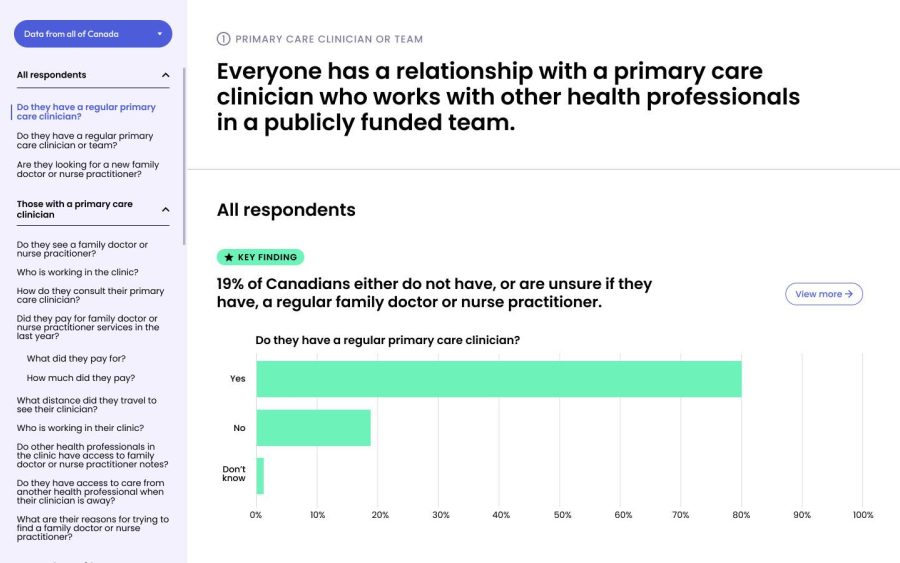
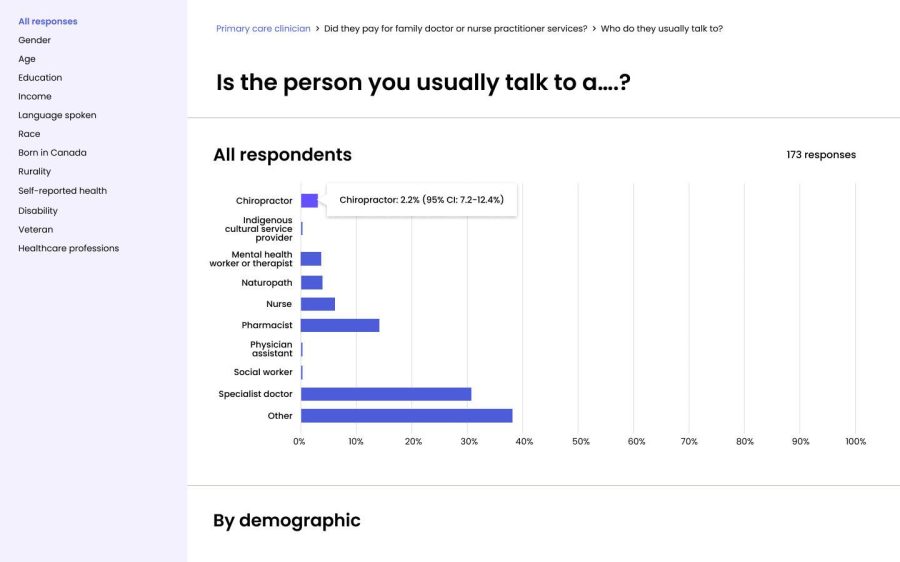
We recently marked an exciting milestone: the release of a set of reports from our latest project, the OurCare Data Explorer, where we designed a new, more intuitive interactive dashboard of data visualizations to help people understand how primary care is delivered across Canada. The response has been immediate and national, with coverage across the Globe & Mail, Toronto Star, CBC News, CTV News, and CBC’s The Current. For a topic that’s often buried in complexity, that kind of visibility says something powerful: when information is clear, accessible, and thoughtfully designed, it travels—it’s how standards are made and maintained.
At Pivot, that’s the core of our work. Good design isn’t decoration—it’s an investment in outcomes. Clearer interfaces reduce cognitive load. Better information architecture supports faster decision-making. Well-designed dashboards turn raw data into something people can act on. And when that happens at scale, the return isn’t just organizational efficiency; it’s improved standards and better quality of life for the people those systems serve.
This project was a chance to show that in action. Our team rethought not just how the report looked, but how it worked: how people would find what mattered, understand it quickly, and feel confident exploring the details. The English and French reports now sit alongside an interactive dashboard that’s easier to navigate, more responsive, and designed to support real-world use.
Design can work to fix systemic challenges—it can remove friction, reduce confusion, and give people tools that help them do their best work. Seeing the national response, and watching the conversation widen across the country, underscores why we keep pushing for design as a strategic lever in complex systems. Congratulations to our client Tara Kiran and her team at Our Care on the launch of this project.
This is what happens when we collaborate to build things that make sense—and make a difference.